Obtaining a set of measured values is usually the easier half of the task. The harder half is processing, storing, and displaying the data sensibly. In this note we will look at Google Sheets, which can cover all these roles.
In the previous part we discussed measuring temperature with 1-wire thermometers. Once we have measured values, it is useful to visualise them so that current values and trends are visible. For example, thermometers can measure the temperature in a cottage and let you check how cold it will be before you arrive.
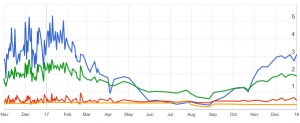
Example chart in Google Sheets
Google Sheets is the familiar spreadsheet. Combined with Google Forms and a little Python, it can serve as a simple time-series database.
Google Forms
For a hypothetical task, let us store and visualise values from two data series: an outdoor and an indoor thermometer. In Google Forms, create a new form, name it, and add two numeric fields, for example Indoor temperature and Outdoor temperature. The goal is a simple form with two inputs.
Then switch to Responses and create a linked spreadsheet. After the spreadsheet is created, open it and perform an important step: in File / Spreadsheet settings, change the locale to United States. Without this, decimal-number processing may not work correctly.
Getting the Google Form URL
Switch back to the form editor and click Send. In the dialog, choose the link tab and copy a URL such as:
This link is now useful for a bit of reverse engineering. Google maps every input field to its own identifier, and we need that identifier for each field.
Open the form in a browser and also open developer tools, in Chrome with Ctrl+Shift+I, and switch to the Network tab. Enter unique test values into the form fields, submit the form, and inspect the request named formResponse.
The first useful value is the request URL:
The second useful part is the mapping of parameters to form-field identifiers in Form Data. From there we can write down, for example:
- Indoor temperature -
entry.1436654893 - Outdoor temperature -
entry.1962412269
Now we have everything needed for programmatic data submission: the URL to send data to and the identifiers under which to send the values.
Filling the Form from Python
Sending the form from Python is straightforward, especially with requests. It makes assembling HTTP POST data and handling errors much easier:
import requests

FORM_URL = "https://docs.google.com/forms/d/e/1FAIpQLSdrmpMxSicngT1OCV9aFPC-VDtOVxEFzg0hk5JRSbjbhpIeNw/formResponse"

ID_VNITRNI = "entry.1436654893"
ID_VNEJSI = "entry.1962412269"

vnitrni = 21.3
vnejsi = -5.7

post_data = {
        ID_VNITRNI: vnitrni,
        ID_VNEJSI: vnejsi,
}
response = requests.post(FORM_URL, data=post_data)
response.raise_for_status()
The code imports requests, defines constants obtained from the form, assigns measured values to variables, stores them in post_data under the field identifiers, and sends them with HTTP POST. If an error occurs, raise_for_status() raises an exception.
After running the code, the linked spreadsheet receives a new row with the submission timestamp and temperatures:

The data is now stored in Google Sheets, where you can use charts or aggregate functions such as minimum or average for user-facing visualisation. Th-th-th-that’s all folks.
Conclusion
If you do not want to send a value, for example because measurement failed, simply omit it from the dictionary. Google Forms inserts an empty value into the spreadsheet.
This storage method is elegant and quick mainly for prototyping. In principle it is just an HTTP POST. From there it is only one step to more sophisticated solutions such as InfluxDB and Grafana. Those can provide much nicer graphs and meters, but they take considerably more effort to set up than a Google Form.